Let’s be honest. Accounting has a reputation for being all about confusing rules and endless numbers. But once you crack a few basic formulas, those financial statements start making a lot more sense.
Whether you run a business, manage a team, study accounting, or just want to dig into your company’s finances, these formulas are windows into your profits, cash flow, efficiency, and financial risks.
Here’s a list of 30 key accounting formulas explained simply, with real-world purpose.
1. Accounting Equation
Assets = Liabilities + Owner’s Equity
This is the backbone of accounting. Everything your business owns is either paid for by the owner or borrowed.
2. Owner’s Equity
Owner’s Equity = Assets − Liabilities
This shows what’s left for the owner, after paying off all the business’s debts.
3. Working Capital
Working Capital = Current Assets − Current Liabilities
Working capital looks at your short-term health can you pay your bills right now?
4. Net Sales
Net Sales = Gross Sales − Sales Returns − Allowances − Discounts
This is what you actually earned from sales, after taking out returns and discounts.
5. Cost of Goods Sold (COGS)
COGS = Opening Inventory + Purchases − Closing Inventory
COGS shows what you paid to get or make the products you’ve sold.
6. Gross Profit
Gross Profit = Net Sales − COGS
This tells you how much money is left after covering the costs to produce your product or service.
Example: Net sales of ₹10 lakh, minus COGS of ₹6 lakh your gross profit is ₹4 lakh.
7. Gross Profit Margin
Gross Profit Margin = (Gross Profit ÷ Net Sales) × 100
This percentage shows how much gross profit you make from each ₹100 sold. Bigger margins usually mean you’re controlling costs well.
8. Operating Profit
Operating Profit = Gross Profit − Operating Expenses
This shows your profit from core business activities before counting interest and taxes.
9. Operating Profit Margin
Operating Profit Margin = (Operating Profit ÷ Net Sales) × 100
Now you see how much profit stays after covering business operating expenses.
10. Net Profit
Net Profit = Total Revenue − Total Expenses
This is your bottom line, plain and simple. Are you making money, or not?
11. Net Profit Margin
Net Profit Margin = (Net Profit ÷ Net Sales) × 100
This shows what percentage of every ₹100 in sales turns into actual profit.
12. Current Ratio
Current Ratio = Current Assets ÷ Current Liabilities
Can you pay your short-term obligations? A quick way to check your near-term financial safety.
13. Quick Ratio
Quick Ratio = (Current Assets − Inventory) ÷ Current Liabilities
Since inventory takes time to sell, the quick ratio is a stricter test what can you turn into cash fast?
14. Debt-to-Equity Ratio
Debt-to-Equity Ratio = Total Debt ÷ Shareholders’ Equity
This tells you how much you’ve borrowed versus what owners have put in. Higher ratios mean more financial risk.
15. Debt Ratio
Debt Ratio = Total Liabilities ÷ Total Assets
What portion of your assets are funded with debt? This gives a quick picture of leverage.
16. Return on Investment (ROI)
ROI = (Net Return ÷ Cost of Investment) × 100
Is your investment worth it? ROI lays it out in simple terms.
17. Return on Assets (ROA)
ROA = (Net Income ÷ Average Total Assets) × 100
How well are you using your assets to make a profit? ROA tells you.
18. Return on Equity (ROE)
ROE = (Net Income ÷ Average Shareholders’ Equity) × 100
ROE zooms in on how much profit you make on shareholders’ money.
19. Inventory Turnover Ratio
Inventory Turnover = COGS ÷ Average Inventory
How often do you sell your entire inventory? Slow turnover might mean stuff isn’t selling.
20. Accounts Receivable Turnover
Accounts Receivable Turnover = Net Credit Sales ÷ Average Accounts Receivable
Are you collecting what customers owe you, or letting cash hang in limbo?
21. Average Collection Period
Average Collection Period = 365 ÷ Accounts Receivable Turnover
On average, how many days does it take for customers to pay up? Faster is better for cash flow.
22. Accounts Payable Turnover
Accounts Payable Turnover = Net Credit Purchases ÷ Average Accounts Payable
How often do you pay your suppliers? This puts your payment habits in focus.
23. Contribution Margin
Contribution Margin = Sales − Variable Costs
How much from each sale is left after covering variable costs? What’s left goes to cover fixed costs and profit.
24. Contribution Margin Ratio
Contribution Margin Ratio = (Contribution Margin ÷ Sales) × 100
Shows the percent of each sale available to tackle fixed costs and generate profit.
25. Break-Even Point in Units
Break-Even Point = Fixed Costs ÷ Contribution Margin per Unit
How many units do you need to sell before you finally break even? It’s where revenue matches total costs.
26. Break-Even Sales
Break-Even Sales = Fixed Costs ÷ Contribution Margin Ratio
Here you find the exact sales value needed to hit break-even.
27. EBIT
EBIT = Net Income + Interest Expense + Income Tax Expense
Earnings before Interest and Taxes shows your operating profit before financing and income tax.
28. EBITDA
EBITDA = EBIT + Depreciation + Amortisation
Earnings before Interest, Taxes, Depreciation, and Amortisation a popular number for comparing core operations.
29. Earnings Per Share (EPS)
EPS = (Net Income − Preferred Dividends) ÷ Weighted Average Common Shares Outstanding
How much profit goes to each share? Investors track this closely.
30. Cash Conversion Cycle
Cash Conversion Cycle = DIO + DSO − DPO
Where:
- DIO = Days Inventory Outstanding
- DSO = Days Sales Outstanding
- DPO = Days Payables Outstanding
How long does cash stay tied up in the business cycle before it turns back into cash? Shorter cycles mean money moves faster.
Why These Formulas Matter
You’re not just memorizing numbers for an exam. These formulas tell you: Are you making money? Are you stable? Do you owe too much? As a student, you get to the heart of financial statements. As a manager or owner, you spot trends, pressures, and opportunities.
The point isn’t just to memorize them, but to actually understand what the answers say about your business.
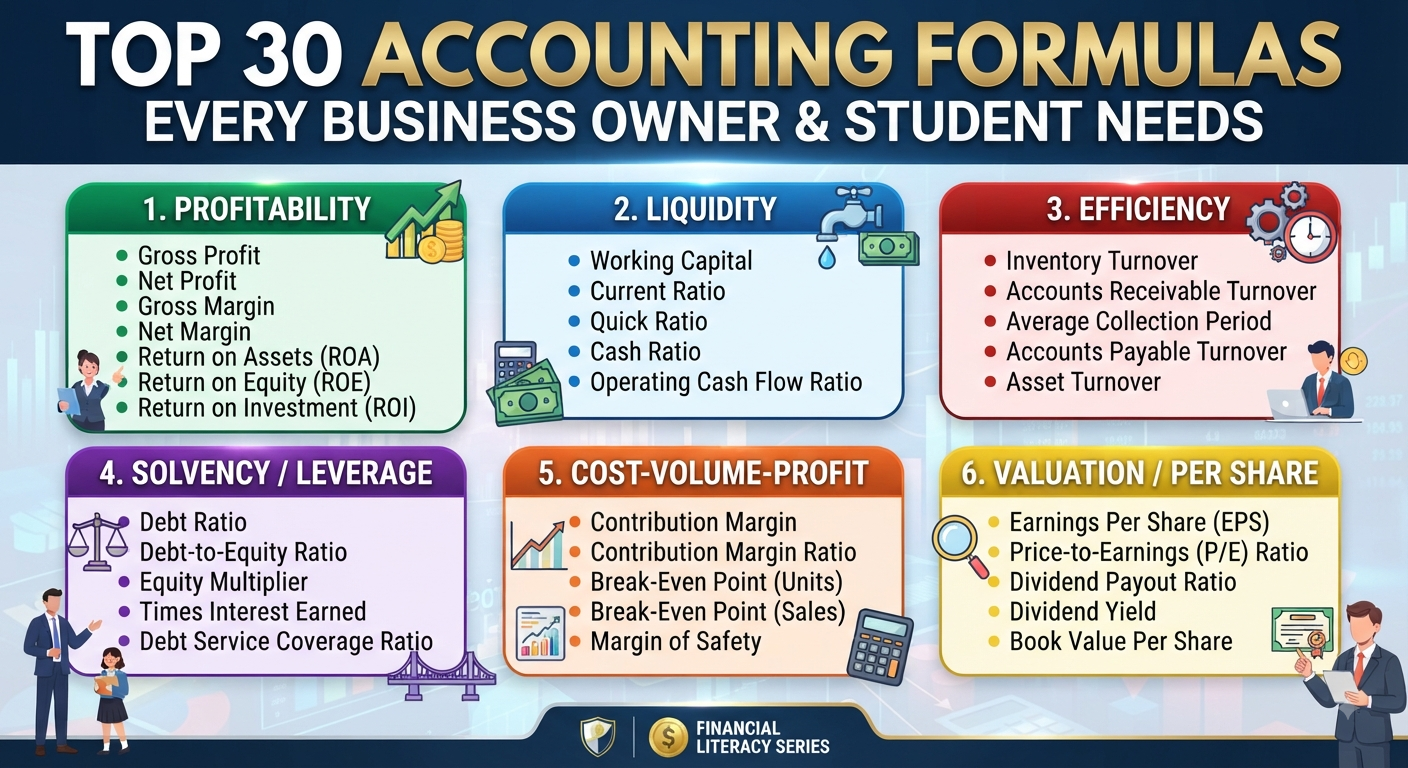
How to Remember Them
You can simplify things by grouping these formulas:
- Profitability: Gross Profit, Net Profit, Gross Margin, Net Margin, ROA, ROE, ROI
- Liquidity: Working Capital, Current Ratio, Quick Ratio
- Efficiency: Inventory Turnover, Receivables Turnover, Collection Period, Payables Turnover
- Financial Leverage: Debt Ratio, Debt-to-Equity
- Business Planning: Contribution Margin, Break-Even Point, Cash Conversion Cycle
When you see them by category, they’re easier to organize in your mind.
Final Thoughts
Accounting formulas aren’t scary they’re just tools to see your business clearly. Start with the basics: accounting equation, gross and net profit, working capital, current ratio, profit margins, and break-even point. Once those make sense, look at efficiency and leverage formulas.
Most importantly, don’t stop at the math. Always ask: What story does this number tell about the business? That’s how you move from rote formulas to being truly savvy with your company’s numbers.
Discussion (0)
Leave a Reply
No confirmed discussions contributed yet. Be the first to start the thread!